This is an image depicting a historical artifact from Ancient Apulia. It appears to be a fragment of painted pottery with visible human figures on it, suggesting the representation of people in various positions or activities. The style and quality of the artwork indicate that it may have been part of a larger piece or a series. The artifact's material is not clearly identifiable from the image alone; however, based on its appearance, it could be ceramic or another type of pottery often used in ancient contexts for decoration or storage.

Chapter 11: E.G.D.Robinson, Archeometric Analysis of Apulian and LucanianRed-Figure Pottery

The image shows a plot with two groups of data points represented by different colors on an x-axis and y-axis grid, with each point corresponding to some measure of size or weight in kilograms as indicated on the axes scales. There is no visible text that provides context or labels for the groups.

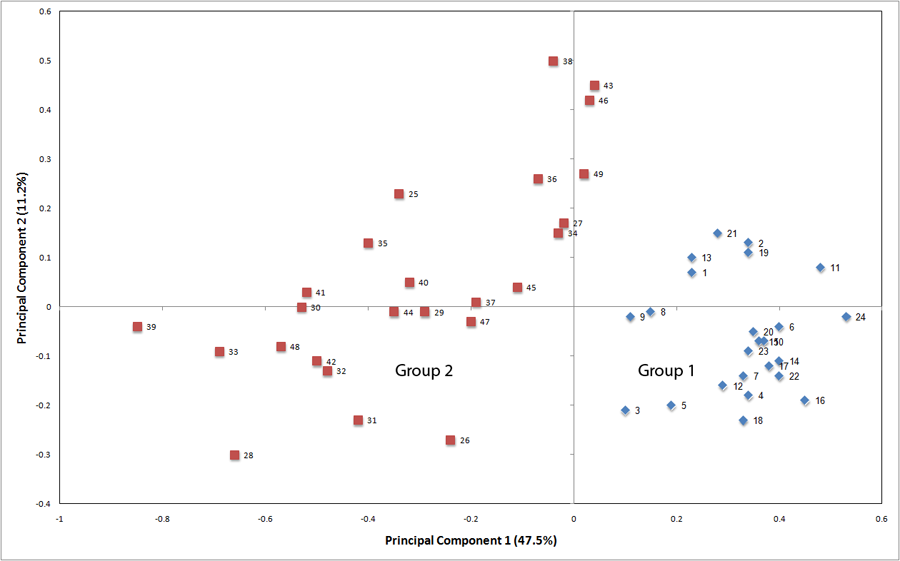
WF 134: Plot of the Principal Components Analysis (PCA) of results for Apulian red-figure samples 1-49.

The image displays a fragmented archaeological artifact composed of several pieces spread across what appears to be a graph. The artifact is likely ceramic, with visible textures and colors indicative of its material. Due to the fragmentation, only part of the entire object can be seen, making it difficult to determine its original form or function.

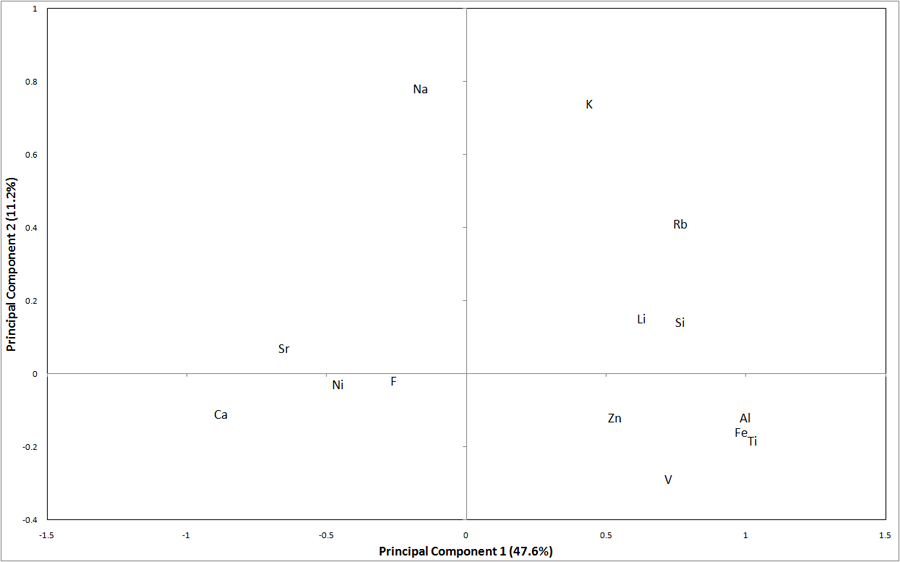
WF 135: Plot of the elemental scores for the PCA in WF 134.

The images show a collection of ancient pottery pieces. These fragments appear to have once been part of larger vessels and are now broken into small segments. They feature various textures and what remains of the original designs or markings, suggesting they may have had cultural significance in their time. The material looks like clay, and some areas reveal the inner layers of the pots, indicating that these artifacts have a rich history and can tell stories about their past usage and environment.

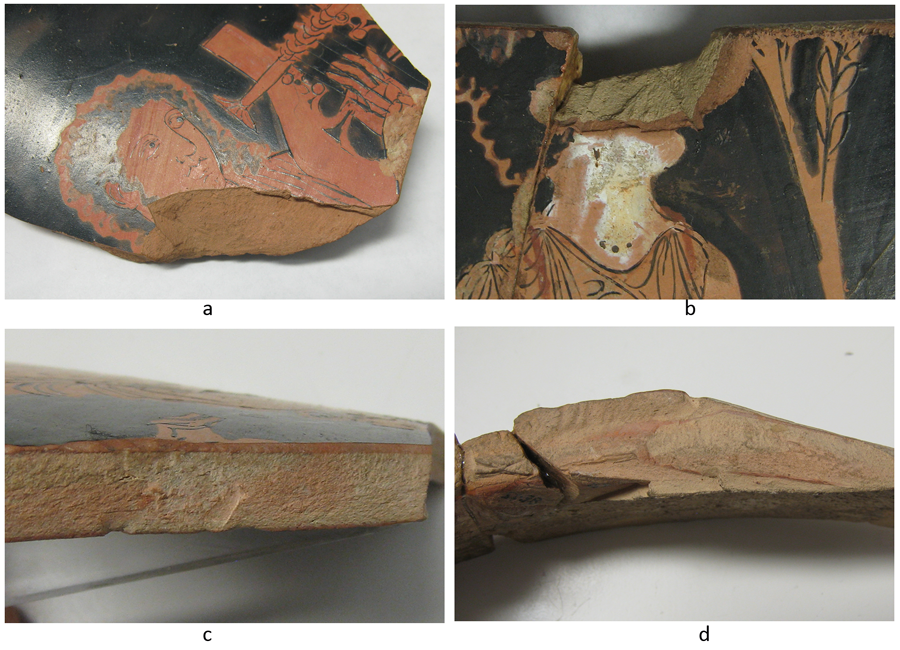
WF 136: Close-up photographs of Apulian red-figure. A: fragment from a volute-krater or amphora by painter near the Lycurgus Painter (sample 19); B: hydria fragment by the Sarpedon Painter (sample no. 29); C: volute-krater fragment by the Darius Painter (sample no. 37); D: Early Ornate hydria fragment (unattributed, sample no. 32).

The image is a geological map detailing different types of terrains such as outer aquifer platform, plio-pleistocene, volcano, and lagonegro unit in the Aegean region with Greek islands.

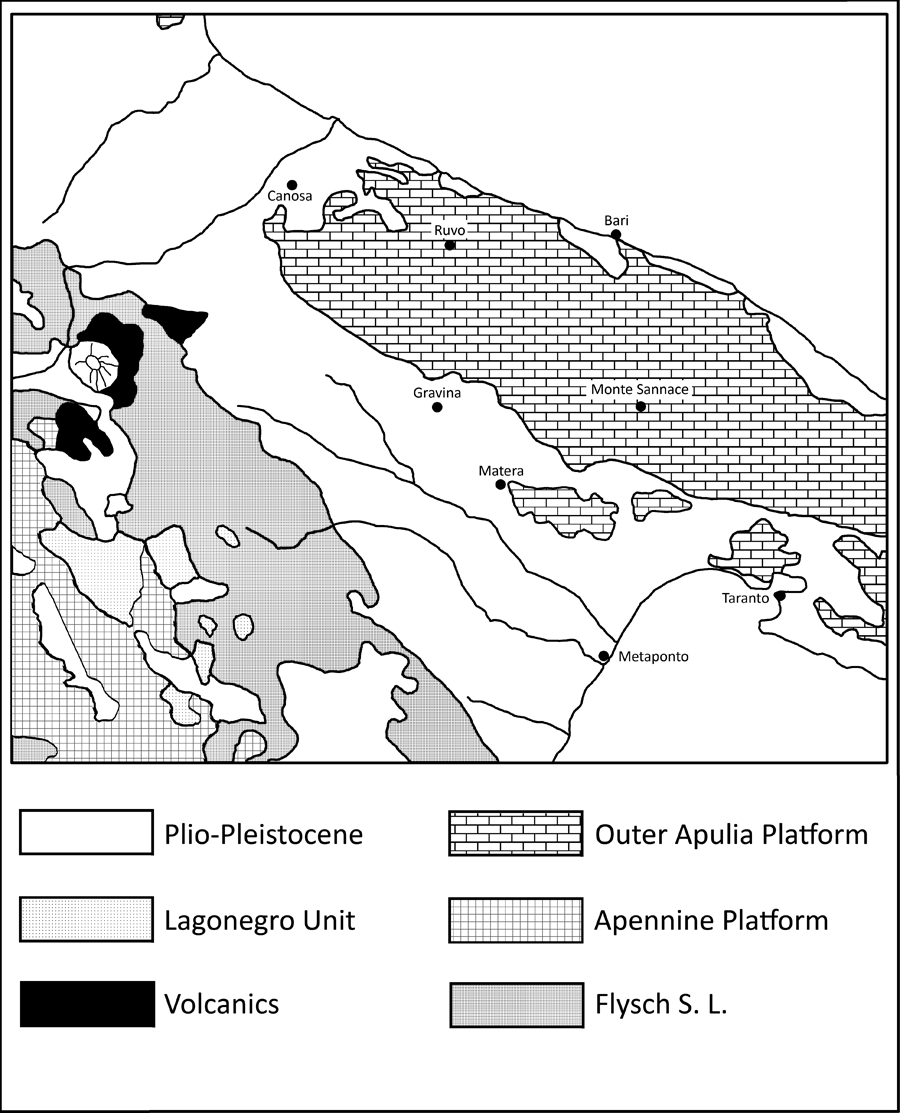
WF 137: Schematic geological map of southern Italy, after Laviano and Muntoni 2007, fig. 5.

The image displays two scatter plots with multiple dots in red, yellow, and blue colors, representing data points for what could be archaeological groups labeled as "group 1" and "group 2." The background is a plain gray, and there are no visible texts or other distinguishing marks on the pots themselves.

WF 138: PCA of samples 1-59, with "provincial" Apulian red-figure and Gnathia pottery (yellow circles).

This is a black-figured Greek vase with a depiction of figures interacting, possibly from an ancient mythological scene. The vase features detailed engravings in relief and showcases the classical artistic style characteristic of pottery from the Hellenistic era.

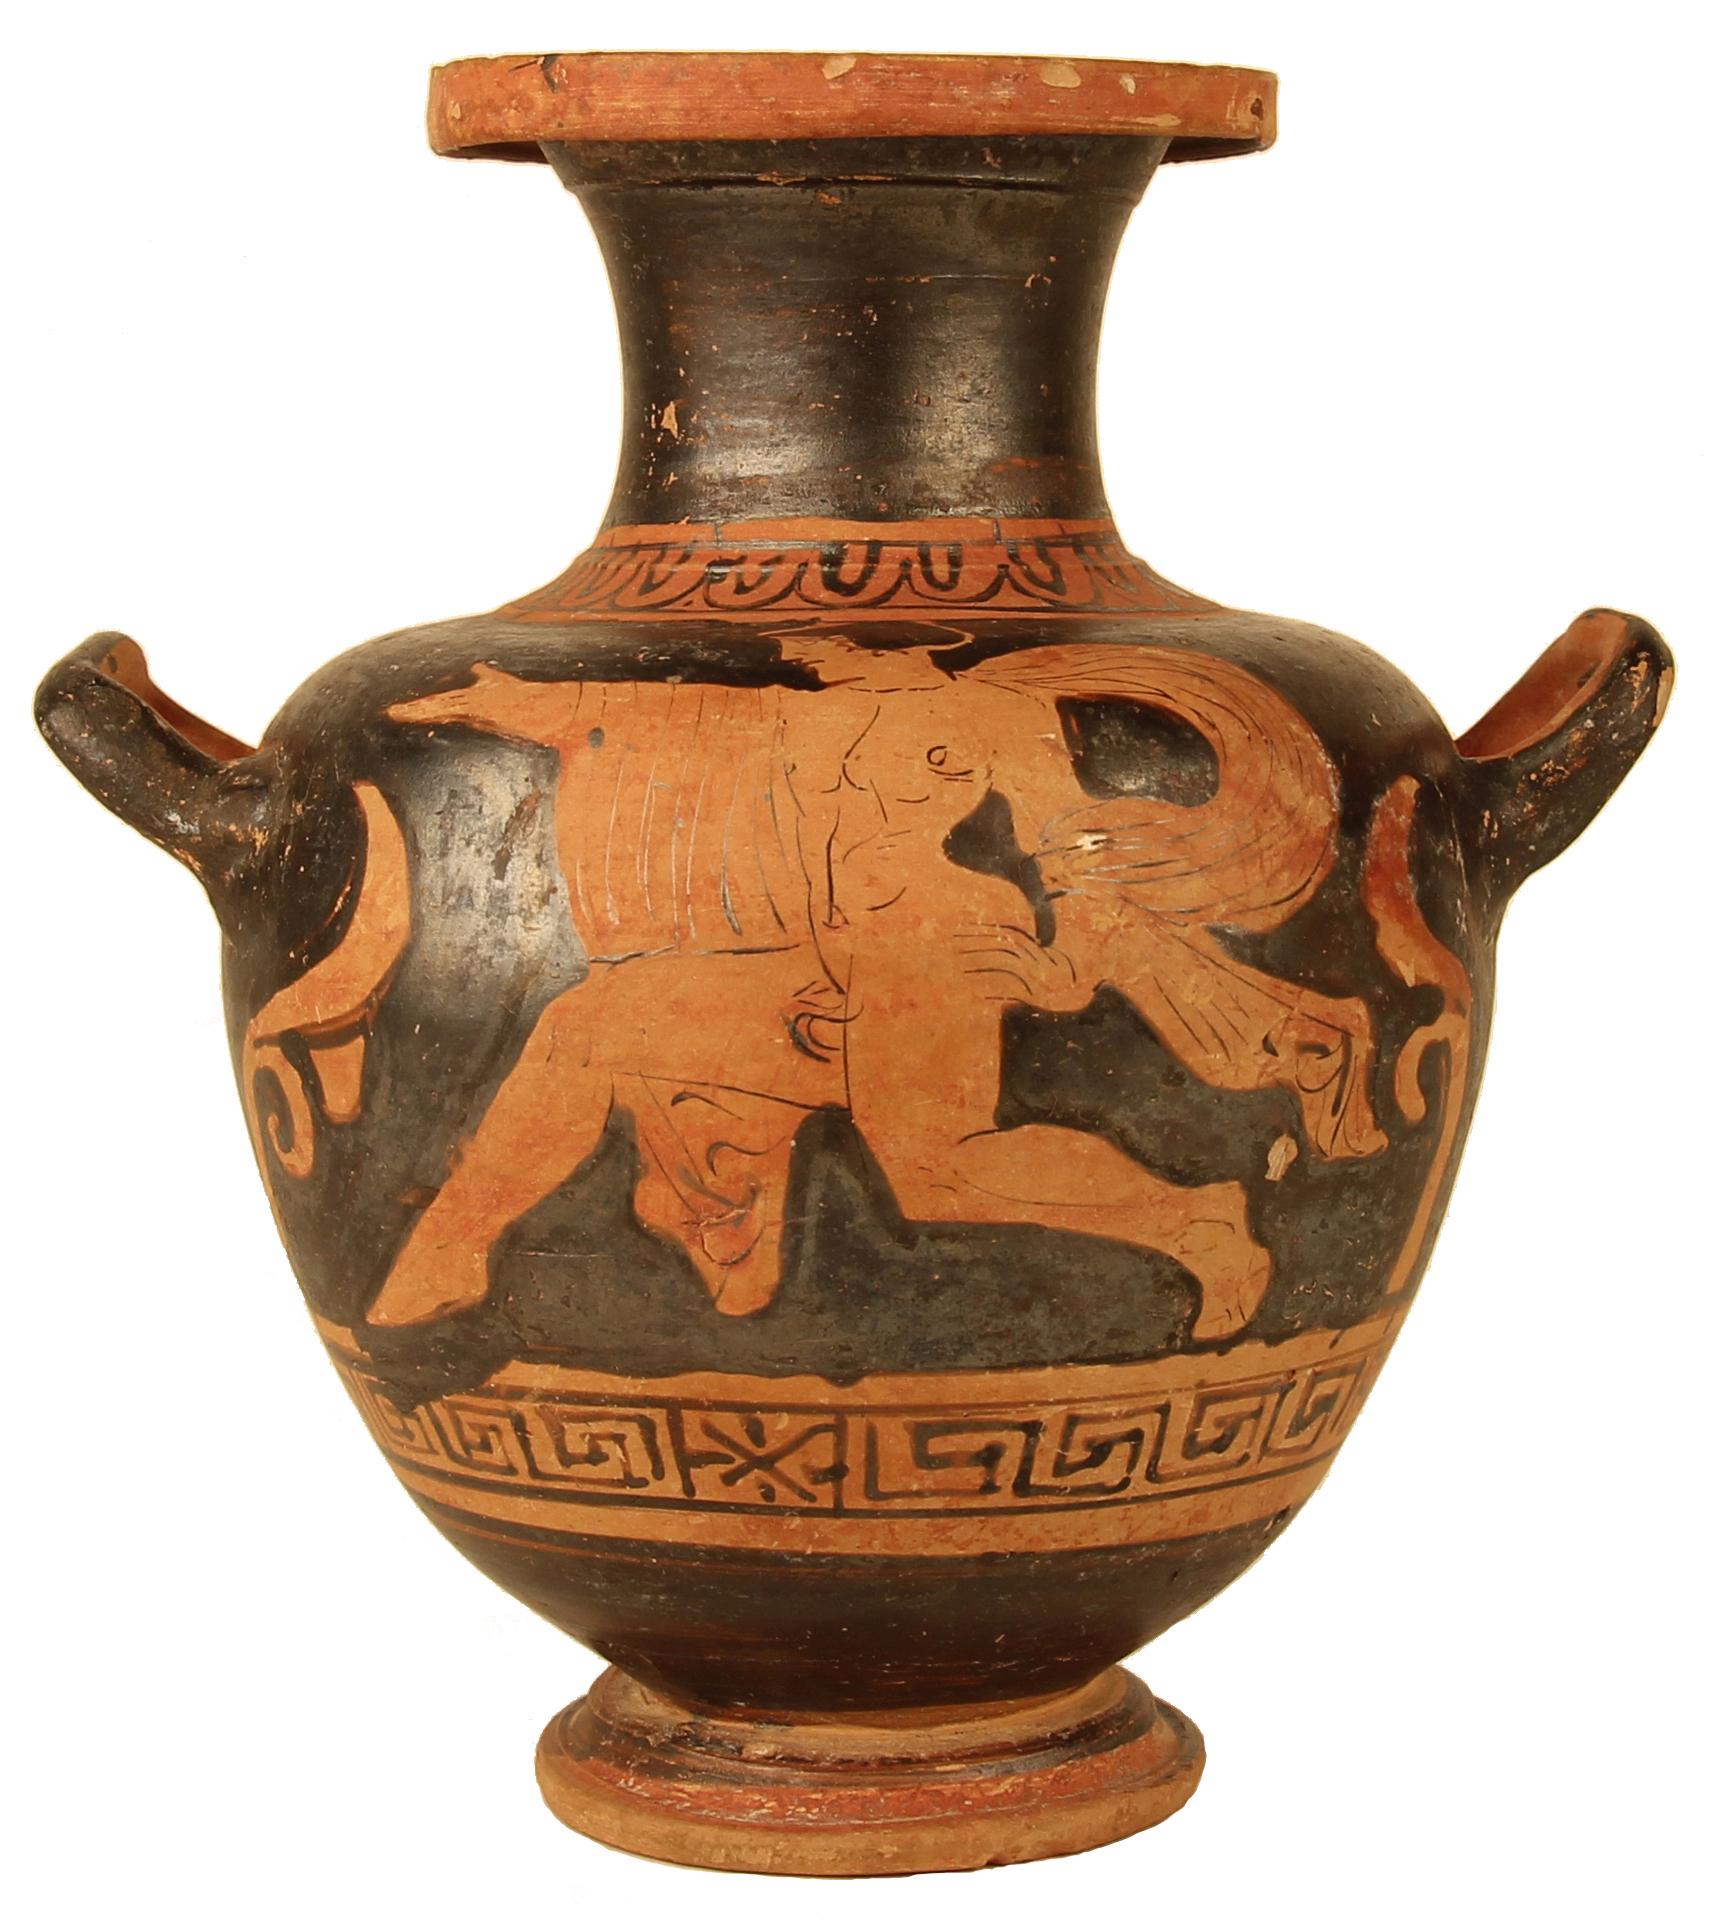
WF 139: Red-figure miniature hydria, Nicholson Museum inv. 98.68 (sample no. 34).

This is a scatter plot graph with multiple groups represented by different colored points on a grid background. The x-axis is labeled "C13" and the y-axis is labeled "C15," suggesting these could be isotopic ratios or some other measure relevant to the data being plotted. Each group is identified by a label such as "Group 2," "Group 4," etc.

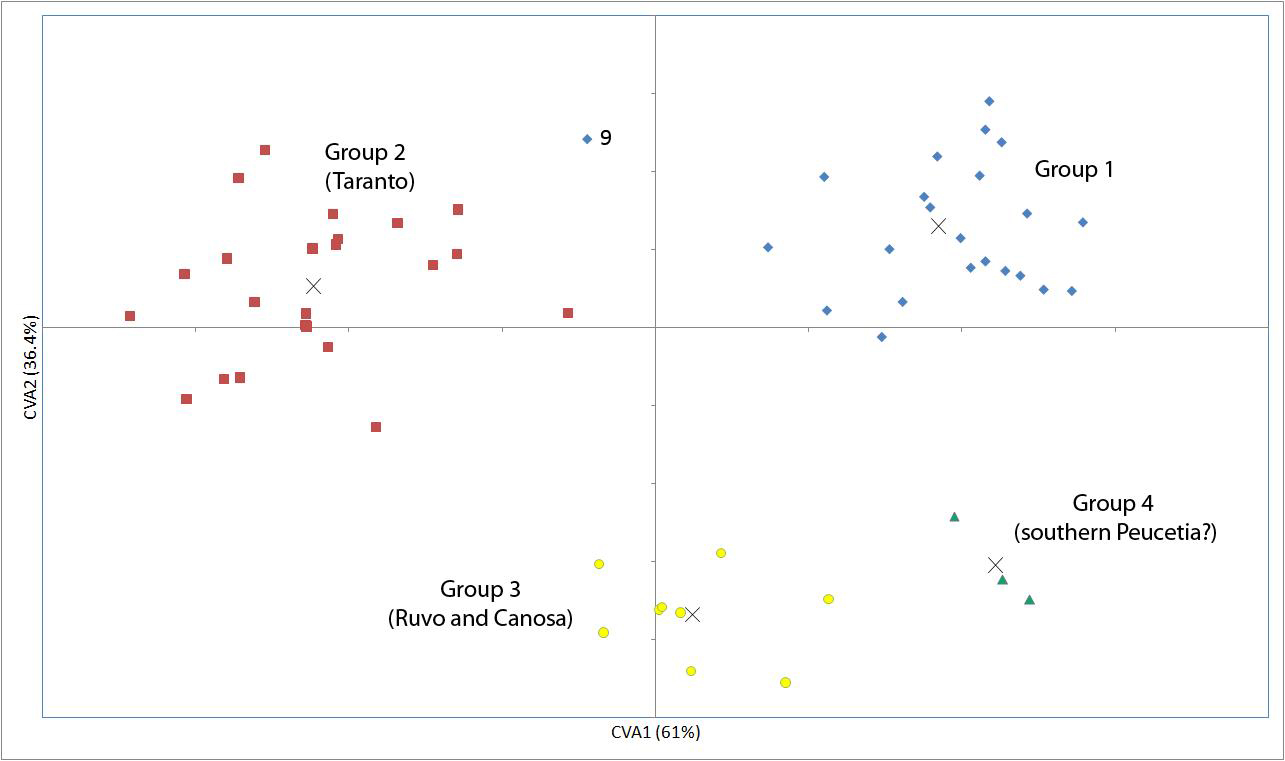
WF 140: CVA of the groups defined in WF 138, with group centroids marked by crosses.

The image shows a scatter plot graph with multiple blue dots on top of a white background. The title "Sydney Painter" suggests that this chart is related to the analysis of an artist's work, possibly in ancient pottery. Key visual features include numerical values alongside the dots and horizontal lines indicating statistical measures such as mean or standard deviation.

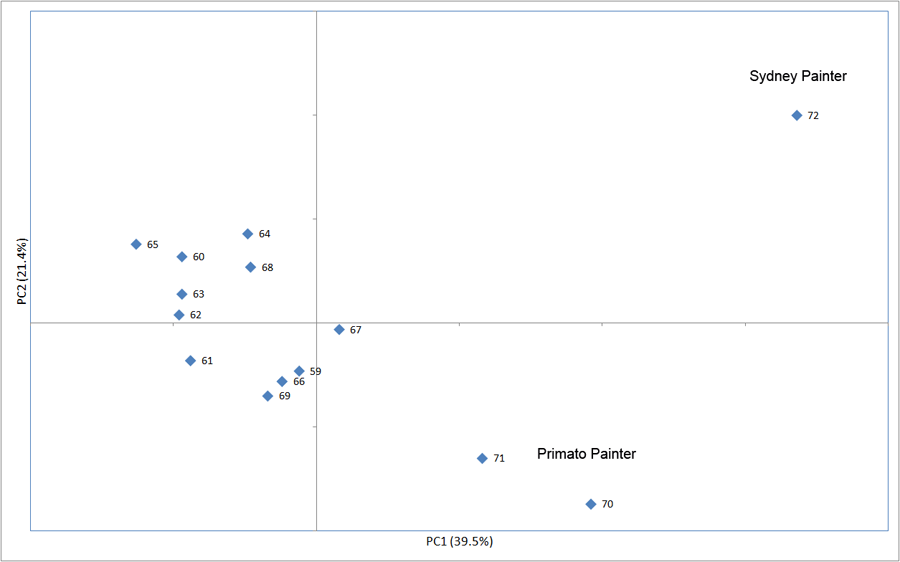
WF 141: PCA of Lucanian red-figure in the Nicholson Museum (permission of the Nicholson Museum)

The image shows a scatter plot with multiple data points indicated by dots in various colors such as blue, red, and yellow. The background is white, providing a stark contrast to the colored dots. There are axes labeled "PC1" and "PC2," suggesting that this graph represents principal component analysis (PCA) results, commonly used in data visualization and statistical modeling.

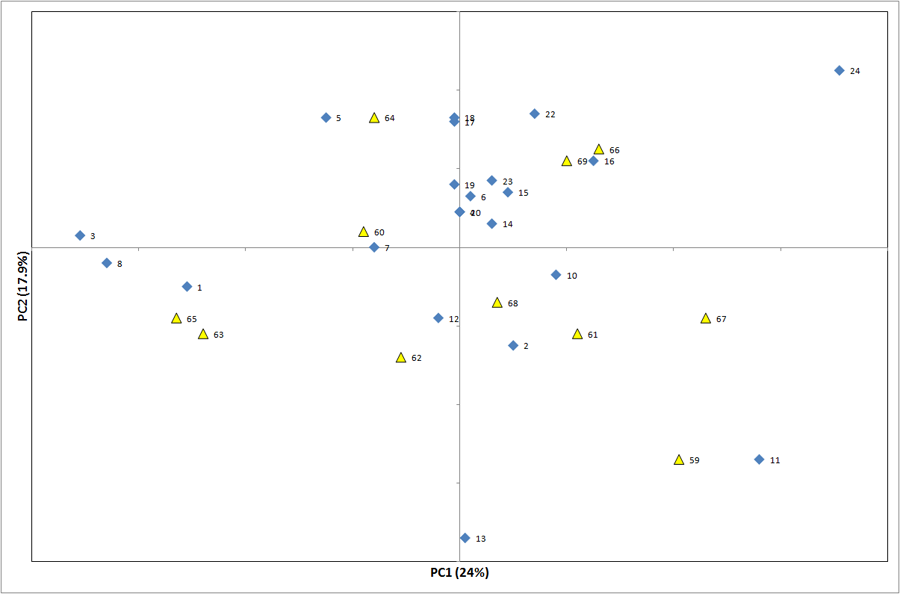
WF 142: PCA of Apulian Group 1 (diamonds) and Metapontine red-figure in the Nicholson Museum (triangles).

A scatter plot graph with two distinct clusters of data points, one in blue and one in yellow, circled on a white background.

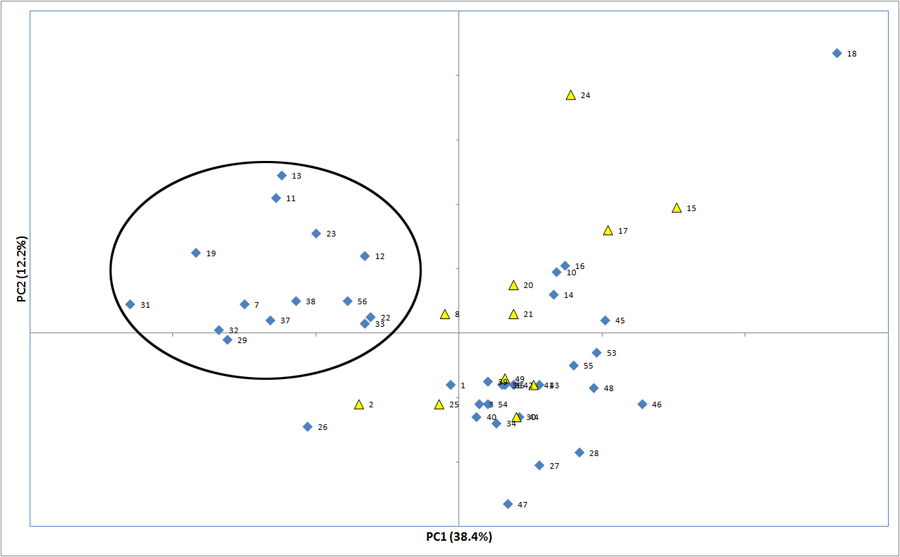
WF 143: PCA of the data reported for Apulian and Lucanian red-figure pottery in Thorn and Glascock 2010, Table 3: Apulian red-figure (diamonds) and Lucanian red-figure (triangles). The samples within the ellipse are precisely the same as Thorn and Glascock's Group 2.